Not All Flood-Lines Are Equal (Part 1)
by Mark Bollaert | Aug 7, 2019 | Flooding
In South Africa, we term the boundary or maximum extent of simulated (or modelled) flooding, flood-lines, which is a common output from a computer model of simulated flooding (or flood model for short). Flood-lines usually relate to a recurrence interval (RI) of interest, which is to say that the flooding simulated approximates a flood with a specific probability of recurrence. The 1:100 year RI event (or the flood that will on average recur, once every 100 years), is our most commonly used design event. The term ‘design event’ merely relates the flooding from a specific recurrence interval (e.g. the 1:100 year RI) to the necessary planning or design required in light of that flooding (e.g. the 1:100 year flood design). While flood-lines are common outputs of a flood model, other flood related outputs such as depth, velocity and hazard are also important.
This post is titled, ‘not all flood-lines are equal’, however, I am not referring to the fact that flooding differs depending on river flow, terrain etc., or looking to discuss different design events as outlined above (e.g. the 1:50 versus 1:100 year RI flood events).
Instead, this post (and Part 2) intend to inform the reader as to the substantial variation in the approach and resulting accuracy and detail that is possible in the simulation of flooding (and by association flood-lines). In so doing, I hope that the reader will have a better understanding of how flood-lines can vary substantially, both project to project and consultancy to consultancy.
Accuracy and Detail
Accuracy and detail are two simple terms that can be used to evaluate a flood model’s results:
- Accuracy refers to the real world value of say, the location of a flood-line or depth of flooding at a point of interest; and
- Detail refers to the representation of change around a point of interest. In the case of the flood-line, it would mean the degree to which that flood-line captures the variation in the terrain (e.g. whether it followed small inlets or embankments). For depth of flooding, it would mean the representation in the change of depth over an area, with greater variation implying more detail and visa versa.
Accuracy and detail are consequently not equivalent to one and other, since a highly accurate flood-line at a point of interest, may be inaccurate around (or near) that point of interest, due to a lack of detail.
Two Components of a Flood Model
The development of flood-lines to define the anticipated flooding from a river at a location of interest, normally relies on two primary components:
- The estimation of the river flow that will cause the flooding (aka flood hydrology). This component seeks to calculate the peak flow or hydrograph of interest, which usually corresponds to a specific design event (e.g. the 1:100 year RI event).
- The simulation of the distribution of river flow as it overtops the banks of the river (aka hydraulic modelling), which uses the flood hydrology estimate (i.e. the peak flow or hydrograph), as discussed in Part 2 of this post.
Flood Hydrology
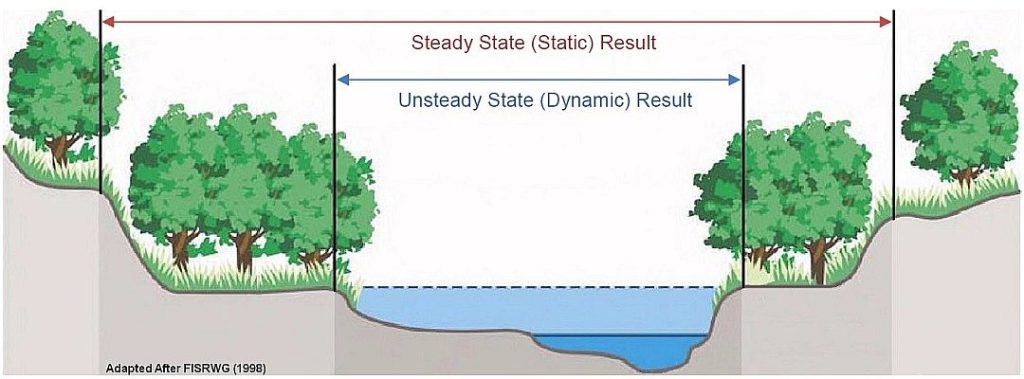
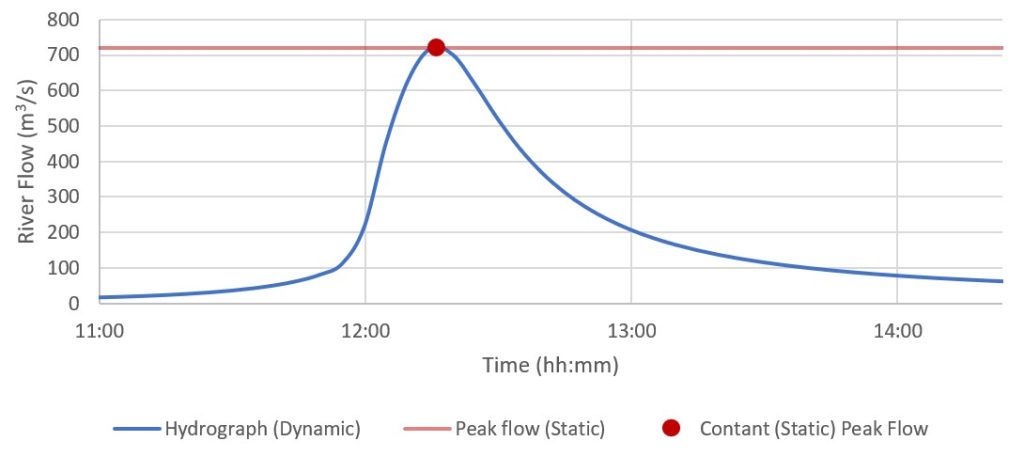
The option of using either a peak flow or hydrograph is a key decision in defining flooding, since as the figure below illustrates, one results in what is termed a static approach (i.e. a constant or static flow representing the peak flow of a flood) while the other results in a dynamic approach (i.e. a hydrograph that shows the dynamic rise and fall of river flow as the flood passes). The use of a static (peak flow) approach usually produces more flooding (and therefore a flood-line with a greater extent) when compared to the dynamic (hydrograph) approach as illustrated by the feature image at the top of this post. This is due to the static approach’s constant peak flow that in reality, only occurs for a brief moment (the red dot in the figure). As a result, the static (peak flow) approach, substantially adds to the simulated flooding producing a conservative flood result (where more flooding is conservative).
Static (peak flow) approaches to flood hydrology are nevertheless routinely used in South Africa. In some instances, the use of peak flow is warranted (e.g. due to quick ‘high-level’ estimates of flooding being needed) while in other instances, they are misapplied possibly as a result of inexperienced or underqualified flood specialists. To limit both length and complexity, this post does not go into detail with regards to the different methods of flood hydrology estimation.
Static approaches to Flood Hydrology are commonly applied in South Africa resulting in a wider flood-line that may limit development options
Dynamic (hydrograph) approaches to flood hydrology appear less common in South Africa, despite their having a direct benefit to the client due to the estimated flooding being realistically reduced compared to static approaches, which assists in planning.
Part 2 of this post discusses the second component of a flood model (i.e. the hydraulic model)
Benefit From Our Experience
At Hydrologic, we default to applying a dynamic approach in our flood studies since this results in a more robust and realistic flooding simulation, which benefits our clients. We nevertheless aim to provide this service at a price point equivalent to and often below those offering static approaches, while benefiting from the flood analysis experience and training gained during three years in the UK, where regulatory and local authority oversight demands flood specialist competency.