Why flood-lines (floodlines or flood lines)
by Mark Bollaert | Nov 21, 2018 | Flooding
At Hydrologic we keenly pursue the latest developments in flood-line modelling that are sure to result in a more accurate, legible and sensible flooding assessment.
Our ability to produce quality work comes from a solid foundation in flood risk that was gained in London between 2007 and 2010. In the UK, flooding is a real concern with major flood events having been on the news in the last few years. This flood risk has required the UK’s Environment Agency to review flood studies produced by consultants, to ensure a suitable level of detail and accuracy in simulated flooding and the planning it informs. The same oversight is unfortunately not possible in South Africa where consultancies are left to their own devices, frequency producing work that would not pass Environment Agency review. To assist those needing to consider flooding, two additional posts entitled Not All Flood-Lines Are Equal are of relevance.
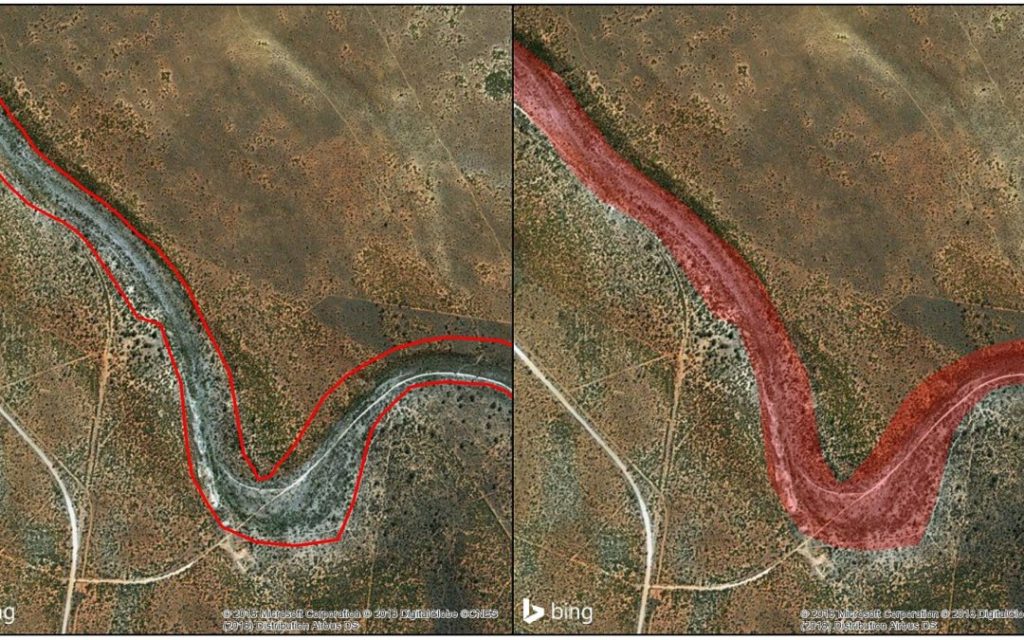
With a flood foundation based on UK experience, my return to South Africa surprised me, when I learnt about the terminology we apply to our most common output of flood models (or simulations); namely flood-lines (just as often written as floodlines or flood lines which is also a peculiar variation). But the variation in naming isn’t my main concern, but rather the use of ‘line’ both in the name flood-line and in the illustration of flood modelling results which seem to nearly always be represented by a line (see the figure above).
The Problem With Lines
Flooding doesn’t occur linearly; it covers an area which varies with regards to flood depth, velocity and hazard. So why take something that is at minimum a 2D (in that it covers an area) and display it as a 1D (linear) result? Perhaps this is just me being pedantic about this particular interest of mine (i.e. flooding), however, I think there’s more to it.
The commonly used 1 in 100 year recurrence interval flood-line (which is applicable to the National Water Act’s Section 21 water uses and Government Notice 704 for mining), can when plotted in full on a map, be used to distinguish the area of expected flooding (although I have seen many maps where it takes a little time to figure out what line refers to what). When you zoom into an area (consider the figure at the start of this post), you often can’t tell which side of the ‘line’ flooding is supposed to occur on, unless you have some elevation data or are familiar with the site (i.e. you know where the rivers are situated). Furthermore, flooding might be broken up into various pathways such as in a braided river system or area where flood waters can over-top a river and follow different routes. If represented by lines, flood results which are not constrained to a single river reach could be highly confusing as you would possibly find it difficult to distinguish between the correct flood-line and pathway. Lastly, line width can also affect the flooding result with a thicker flood-line easily covering an area of over 10m resulting in inaccuracy and a negative impact on planning.
Inundation Boundaries
That is why I have always found flood-lines to be unsuitable. Surely we should be using a more sensible term such as ‘inundation boundaries’ (or similar) that speaks to the outer boundary of an area covered by flooding. The term ‘inundation boundaries’ is in fact used by the developers of the world’s most popular flood modelling software – the US Army Corps of Engineers, Hec-Ras software. Assuming we did use ‘inundation boundaries’ in South Africa, we would also simultaneously solve the variation in flood-lines, floodlines and flood lines). Until then, I’ll just go along with flood-lines as per Government Notice 704 and hope that we find some consistency down the road.
Additional Relevant Output
In South Africa, we deal almost exclusively with flood-lines, yet there is additional output from flood modelling that is highly relevant. This includes depth, velocity and (perhaps most importantly) hazard results. Hazard results classify flood depth/velocity according to a hazard rating (e.g. low, medium and high) and have real world value when it comes to planning, since flooding that is 10cm deep and barely moving shouldn’t be considered the same as flooding caused by fast moving water, 2m deep. Unfortunately, flood-lines cannot provide this added detail. The absence of additional outputs as a requirement when producing flood results, while a concern, has not been discussed in the post in detail.
How can we help you
Contact us to find out more about the flood risk to your property or site and let us help you find the approach that gives you the best cost to benefit flood solution.